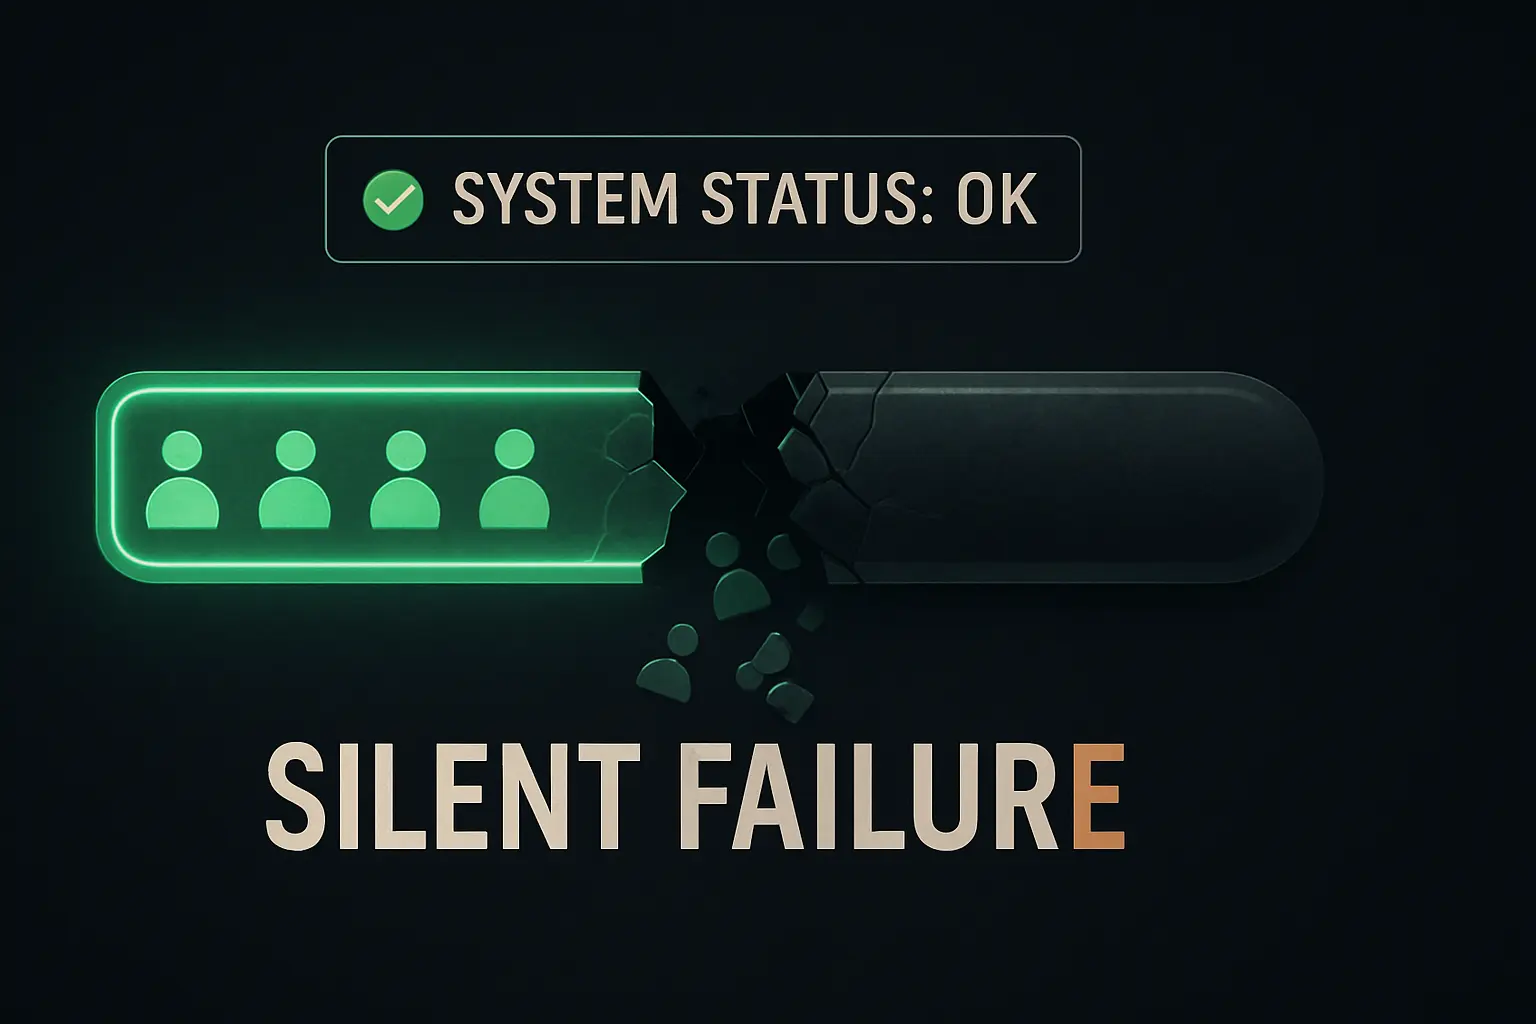
There’s a particular kind of quiet that’s more unsettling than a loud alarm: the silence of a system that appears to be working perfectly. All dashboards are green. No error notifications are firing. Yet, under the surface, a critical process has ground to a halt.
This is what happened to us at Mehrklicks, my marketing automation agency, when we experienced a ’silent failure.‘ For seven consecutive days, our primary lead nurturing sequence was broken. The system itself didn’t know it was failing, so it never sent an alert. We only discovered the problem through a casual human observation, long after the damage was done.
This post-mortem isn’t just about what went wrong. It’s about a fundamental lesson in system design—you must build systems that not only perform a task but also prove they are performing it.
The Illusion of a Healthy System
Our setup was straightforward. When a potential customer fills out a form on a landing page, our automation platform takes over. It’s supposed to:
- Tag the new contact in our CRM.
- Send an immediate welcome email with the requested resource.
- Initiate a 5-part educational email sequence over the next two weeks.
It’s a standard, reliable workflow that has processed thousands of leads. Our monitoring checked the usual suspects: server uptime, API endpoint availability, and platform status. Every check came back green.
From the outside, the machine was running smoothly. This was a classic case of what engineers call black-box monitoring—we were checking if the system was on, not what it was actually doing.
The Breakpoint: A Single Point of Failure Hidden in Plain Sight
The failure occurred at the most vulnerable point: the handoff between two internal steps. A minor, unannounced update to an API connection within our automation software caused the trigger for ‚Email 1‘ to fail silently. The lead was captured correctly but never entered the nurturing sequence. It just sat there in the database, waiting for a command that would never come.
The system generated no error because, from its perspective, no ‚error event‘ occurred. The first step (capturing the lead) was successful; the condition to trigger the second step was simply never met. The process didn’t crash. It just… stopped.
This is the very definition of a silent failure—a breakdown that goes undetected by the system itself because it doesn’t trigger any built-in error-handling logic.
Quantifying the Silence: The 7-Day Detection Gap
We finally noticed when a sales team member asked, ‚Traffic seems good, but I haven’t seen any inbound leads from the new campaign this week. Is everything okay?‘
A quick manual check confirmed our fears. An entire week’s worth of high-intent leads were sitting in digital limbo. The time between the initial failure and our discovery is the detection gap. Ours was seven days long.
The business impact was severe. Research shows that a five-minute increase in lead response time can decrease qualification by 10x. Our response time had increased to infinity.
We lost immediate opportunities, wasted ad spend driving traffic to a broken funnel, and—worst of all—eroded the trust of prospects who reached out only to hear nothing back.
From Monitoring to Observability: Building a System That Speaks Up
The failure exposed a critical flaw in my approach. I had designed a system to succeed but hadn’t properly designed it to report its own failures. The solution wasn’t just to fix the broken link; it was to rethink our entire monitoring philosophy and move from simple monitoring to genuine observability.
Observability is the ability to understand the internal state of a system just by observing its outputs. For us, that meant adding new layers of validation that focused on outcomes, not just processes. This shift is central to the principles of building scalable systems that are resilient and trustworthy.
Here’s the new, three-layered monitoring system we implemented:
-
Volume Threshold Alarms
Instead of just checking if the system is ‚on,‘ we now track the volume of successful outcomes. Our system knows that a typical weekday should yield at least X number of leads. If the number of contacts successfully completing the first step drops below this baseline for more than a few hours, a human gets an alert. This is a form of white-box monitoring, where we look at internal metrics to verify health. -
End-to-End Canary Testing
Every hour, an automated script adds a fake lead (e.g., ‚canary.test.01@jvglabs.com‘) to the funnel. A separate script then checks our CRM to confirm that same lead appeared and was tagged correctly within 15 minutes. If the canary lead doesn’t complete its journey, the system is considered broken, and an alert is triggered immediately. This tests the entire workflow from start to finish. -
CRM Entry Check
As a final backstop, a simple check runs twice a day. It queries our CRM for the number of new leads added from that specific funnel in the last 12 hours. If the count is zero, it flags the system for review. This directly measures the business outcome we ultimately care about.
This multi-layered approach ensures that even if one monitoring method fails, another will likely catch the anomaly. It’s a core part of how we structure our marketing automation experiments—building in feedback loops from the very beginning.
Key Lesson: Design for Failure, Not Just Success
The most dangerous assumption an operator can make is that silence means success. A silent system isn’t necessarily a healthy one; it may simply be a system that doesn’t know how to ask for help.
The goal is to design systems that don’t just work, but also report on their own health. This incident was a costly but valuable reminder that a successful outcome is the only true measure of a system’s health. Don’t just watch for red flags; make sure you’re consistently seeing the green ones.
Frequently Asked Questions (FAQ)
What exactly is a ’silent failure‘?
A silent failure is an error that doesn’t trigger any alerts or error messages. The system continues to run and appear healthy, but a specific part of its process is broken. For example, data might be collected but never sent to its destination, and the system doesn’t register this as an error.
Isn’t my automation software supposed to tell me when there’s an error?
Yes, for common errors like a server being down or an incorrect password. However, these tools often can’t detect ‚logic‘ errors. In our case, the software successfully completed its first task and then stopped because the conditions for the next task weren’t met. There was no ‚error‘ to report, only a lack of a successful outcome.
How can a small business implement this without an engineering team?
You don’t need complex code to start. The simplest form of observability is a manual check. Create a daily or weekly checklist: ‚Manually verify at least one new lead from yesterday is in the CRM with the correct tag.‘ You can also use tools like Zapier to build simple checks, such as a workflow that counts the new rows in a Google Sheet each day and emails you the total. If you see a zero, you know to investigate.
What’s the difference between monitoring and observability?
Monitoring is about asking your system pre-defined questions, like ‚Is the server’s CPU usage below 80%?‘ or ‚Is the website online?‘ Observability is about equipping your system to answer questions you haven’t thought of yet. It relies on collecting rich data (logs, metrics, and traces) so that when something unexpected happens, you can dig in and understand why. Our new threshold and canary checks move us closer to true observability.
Next Steps: Moving From Reactive to Proactive
This experience forced a shift in my thinking. I now spend less time building new automations and more time instrumenting the ones we already have. A system you can’t trust is a liability, not an asset.
I encourage you to look at your own critical systems, whether in marketing, operations, or finance. Are you just waiting for alarms, or are you actively confirming success? The absence of bad news is not the same as good news. Go check.