When I started mapping out PvKnowHow, the goal was deceptively simple: create a knowledge platform for the solar industry. But the real experiment wasn’t about solar itself—it was about building a system.
The core questions were strategic: How do you take a niche topic and build a scalable, data-driven intelligence asset from the ground up? And how do you evolve a simple content portal into a structured system that generates its own authority?
The landscape was already crowded. On one side, you have institutions like the IEA publishing incredibly dense, authoritative reports—essential but often impersonal and inaccessible. On the other, high-frequency news outlets like PV Magazine, which are vital for staying current but whose content is ephemeral by nature.
The gap was clear. While others documented market trends, no one was documenting the process of building an intelligence system or revealing the architecture behind the analysis. That became the core mission of PvKnowHow: to serve as a live case study in system design, documenting every phase of its own evolution. This is that story.
Phase 1 – Foundation: The Center of Gravity (June – Dec 2024)
Our journey began not with a complex database but with a simple video portal. The initial hypothesis was that every scalable system needs a solid, over-simplified core to build upon. We launched with a small library of instructional videos and a foundational course.
The first strategic move was to surround this video core with simple, text-based blog posts. Each article directly mirrored a video topic, creating our first content clusters. The observation was immediate, if small: these posts gave us our first SEO heartbeat. They began ranking for long-tail keywords, acting as signposts for the deeper video content.
This taught me a critical lesson in system design: you must first establish a „center of gravity“ before trying to expand. The videos and their corresponding articles became that center, defining our initial scope and giving search engines a clear, unambiguous signal about PvKnowHow’s purpose. Without this stable core, any future expansion would have been chaotic.
The insight from this phase was foundational: Every complex system starts with a simple, defensible core. Scale comes later.
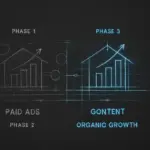
Phase 2 – Activation: The Relevance Engine (Jan – Apr 2025)
With the foundation in place, the system needed to breathe. It needed a pulse. That pulse came from launching a dedicated solar news section. This was a direct response to observing how high-frequency publishers dominate topical queries. While we couldn’t compete on volume, we could compete on relevance within our niche.
When we launched the news feed, the traffic curve finally woke up. We saw that Google rewarded frequency, but only when it was tightly anchored to our established core topic. For example, news about perovskite solar cells resonated because we already had foundational content on cell technology. Similarly, reports on EU policy changes gained traction because our core content had already established our authority in the global market.
From a system perspective, the news section acted as a „relevance engine.“ Each new article was a signal to search algorithms that our domain was active, current, and constantly updating its knowledge base. It was the system’s heartbeat, pumping relevance through the static arteries of our foundational content.
This led to a crucial insight: Frequency without structure is noise. Frequency with structure is authority. The news feed wasn’t just content; it was a mechanism for keeping the entire system relevant.
Phase 3 – Expansion: The Scalable Content Model (May – Aug 2025)
The news section gave us traffic, but it was volatile. A big story one week would be forgotten the next. The real turning point—the moment PvKnowHow shifted from a portal to an intelligence system—was the creation of the „Solar Reports.“
These weren’t articles; they were structured data hubs, starting with comprehensive country-level reports. For each country, we aggregated key market data, production capacity, and investment landscapes. This was a direct move to capture the search intent that drives users to institutional sites like SolarPower Europe, but presented through our accessible, systemic lens.
Given the global solar market is projected to hit nearly $390 billion by 2034, decision-makers need this data in a clear, comparable format.
The observation was profound. Traffic from news was spiky and unpredictable; traffic to the Solar Reports was stable, growing, and incredibly high-value. We were attracting analysts, investors, and manufacturers—the exact audience we wanted.
From a systems standpoint, this was our first truly scalable content model. We designed a template that could be replicated for every country, turning a single format into a global database. This is a principle we also test in our wider Portal Network, where templated structures are key to scaling across different niches.
The insight was a game-changer for our strategy: Scalability isn’t about creating more content; it’s about designing better systems that generate value repeatably.
Phase 4 – Systemization: Layering Depth and Authority (Sep – Oct 2025 → ongoing)
Once the country report framework was live, the final phase—systemization—began. The reports were the skeleton; now we needed to add the muscle and connective tissue. We started layering new data dimensions onto each country report.
For each country, we began adding deep-dive articles on sub-topics:
- Production Infrastructure: Analyzing local manufacturing capacity, which is critical as global capacity is expected to triple the installation rate by 2025.
- Political Stability & Policy: Tracking regulations like the US Inflation Reduction Act, which fundamentally reshapes supply chains.
- Market Demand Drivers: Examining local energy needs and consumer adoption rates.
- Local Industry Ecosystems: Mapping the key players, from raw material suppliers to installers.
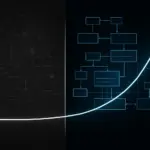
The pattern that emerged was a powerful feedback loop. These deep-dive articles, rich with specific long-tail keywords, started ranking on their own. Crucially, every one of them linked back to the main country report. This created a dense internal linking network that funneled authority upwards, dramatically boosting the ranking power of the core reports.
From a system view, we were building a semantic network. Each new data layer wasn’t just another article; it was a new loop of relevance that made the entire country silo smarter and more defensible. This is the same logic we apply when designing automated Solar Sales Systems, where every piece of data enriches the core client profile.
This brought us to our current operating principle: Mature systems grow by increasing their depth, not just their width. Each layer of analysis makes the whole system exponentially more valuable than the sum of its parts.
Frequently Asked Questions
Why not just build a standard news site or data portal?
Because the goal isn’t just to provide information, but to build a transparent asset. While a standard news site competes on speed and a data portal competes with massive institutions, PvKnowHow competes on transparency and methodology.
By documenting its own growth, it serves a unique audience of systems thinkers and builders who are interested in the „how“ behind the data, a niche that competitors completely ignore.
How can a project like this compete with institutions like the IEA?
We don’t compete on their terms. The IEA provides the definitive, institutional „what.“ PvKnowHow provides the entrepreneurial, first-person „how“ and „why.“ Our unique value is the narrative layer.
While an analyst goes to the IEA for a final dataset, they come to PvKnowHow to understand the architectural thinking behind structuring that kind of information. We’re not an alternative; we’re a complementary resource for a different, more strategic kind of thinking.
What is the role of automation in this system?
In the early phases, the process is largely manual to ensure the logic is sound. However, as we move into Phase 4 and beyond, automation becomes critical.
We are developing systems to automatically pull in and structure public data for the reports, flag outdated information, and suggest internal linking opportunities between new deep-dive articles and the core country hubs. The goal is a human-guided system where automation handles 80% of the data aggregation, freeing us up for high-level analysis.
How do you ensure data quality and freshness in the Solar Reports?
This is a core challenge. Our system combines automated data scraping from trusted public sources (like government energy departments and financial reports) with a scheduled manual review process. Each report has a „last updated“ stamp, and our internal system flags data points that haven’t been verified in over a quarter.
The news feed (Phase 2) also acts as an early-warning system, alerting us to major market shifts that might require an immediate update to a specific country report.